
A solar shade analysis measures how nearby obstructions, chimneys, trees, hills, even neighbouring roofs, will block sunlight from your proposed solar panels over a full year, and predicts the energy loss that shading will cause — for a practical how-to guide, see Solar Shade Analysis: A Practical Guide for PV Design. The headline output is a single number: predicted annual energy loss due to shading, usually expressed as a percentage.
Three things matter immediately. First, your report should show typical outputs: an annual loss figure, a monthly breakdown, and a per-panel heatmap. Second, insist on a specific deliverable from your installer, not a verbal assurance.
- A report referencing recognised methods, such as the ES‑SO technical guidebook standards
- A named tool behind the numbers, such as Shadowmap or PVsyst
- An accuracy claim you can question, since drone photogrammetry and 3D modelling typically reach around ±2 to 3% annual error under good conditions
Key Takeaways
A solar shade analysis quantifies predicted annual energy loss from shading and should always include a monthly breakdown and per-panel heatmap, not just one annual number.
| Point | Details |
|---|---|
| Core output | Annual shading loss percentage is the headline figure, but demand the monthly breakdown behind it. |
| Non-linear losses | Small shaded areas can cause disproportionately large string losses due to bypass diode behaviour. |
| Key metrics to know | Sun access, HSA, VSA, and horizon profile all describe different aspects of the same shading problem. |
| Data source matters | Drone photogrammetry and LIDAR outperform satellite-only estimates on tree-heavy or complex roofs. |
| Ask before you sign | Smarthometechnical provides annotated layouts, horizon profiles, and costed MLPE options as standard on every site survey. |
Table of Contents
- What does a solar shading analysis actually cover?
- Why does shading matter more than most homeowners think?
- What do the metrics on a shade report actually mean?
- How do installers actually collect shading data?
- Which software tools produce these shade reports?
- How do you read a shade report without missing the important bit?
- What design changes come out of a shade analysis?
- What should you demand from your installer’s shade report?
- A publisher’s note on why this matters on site
- Get a proper shade analysis for your roof
- Where to read more on solar shading standards
- Frequently asked questions
- Sources
What does a solar shading analysis actually cover?
A shade study models three distinct types of obstruction, and mixing them up is where a lot of confusion starts. Near shading covers chimneys, dormers, aerials, and nearby trees, things close enough to cast a sharp, defined shadow. Far or terrain shading covers hills, ridgelines, and distant buildings that lift the effective horizon. Self-shading is the array shading itself, one row of panels blocking the row behind it on a low winter sun.
Where does this get used?
- A standard suburban rooftop with a chimney or a satellite dish nearby
- A garden with a mature oak tree that only shades the array for part of the afternoon
- A terrace or facade-mounted array where a neighbouring building changes the picture entirely
- Ground-mounted arrays and carports where multiple rows shade each other in winter
A finished shade analysis typically hands you an annual loss percentage, a monthly breakdown, a colour-coded heatmap showing which specific panels lose the most, and a sun-path diagram.
Why does shading matter more than most homeowners think?
Shading doesn’t cause a proportional loss. Bypass diodes limit the damage by routing current around the shaded cells, but they don’t eliminate the problem.
Industry guidance on shading electrical mechanisms explains why installers increasingly avoid long strings on partially shaded roofs. A single chimney shadow crossing three panels in a ten-panel string can drag the whole string’s output down for hours each day, not just the shaded cells.
- Persistent partial shade raises hotspot risk, where shaded cells run hotter and degrade faster
- Commercial and larger residential projects face lender scrutiny, since financiers want to see a defensible loss figure before underwriting the system
- Warranty claims sometimes hinge on whether shading, not a manufacturing fault, caused underperformance
Statistic Callout: Reported accuracy for 3D modelling and drone photogrammetry sits around ±2 to 3% annual error, a useful benchmark when judging whether a quoted shading loss figure is trustworthy.
Pro Tip: *Always ask for the monthly breakdown, not just the annual figure.
What do the metrics on a shade report actually mean?
Reports throw a lot of terminology at you, and most of it isn’t explained in plain terms. Here’s what the common ones mean and how they show up in practice.
Sun access (sun-hours) measures the percentage of available sunlight actually reaching a specific point on your roof across the year.
Annual shading loss (%) is the headline energy figure, the estimated reduction in kWh output caused specifically by shading, separate from other losses like inverter clipping or soiling.
TSRF (Total Solar Resource Fraction) and TOF (Tilt and Orientation Factor) appear in some North American-style reports and combine shading with the panel’s tilt and compass direction to give a single site-suitability score.
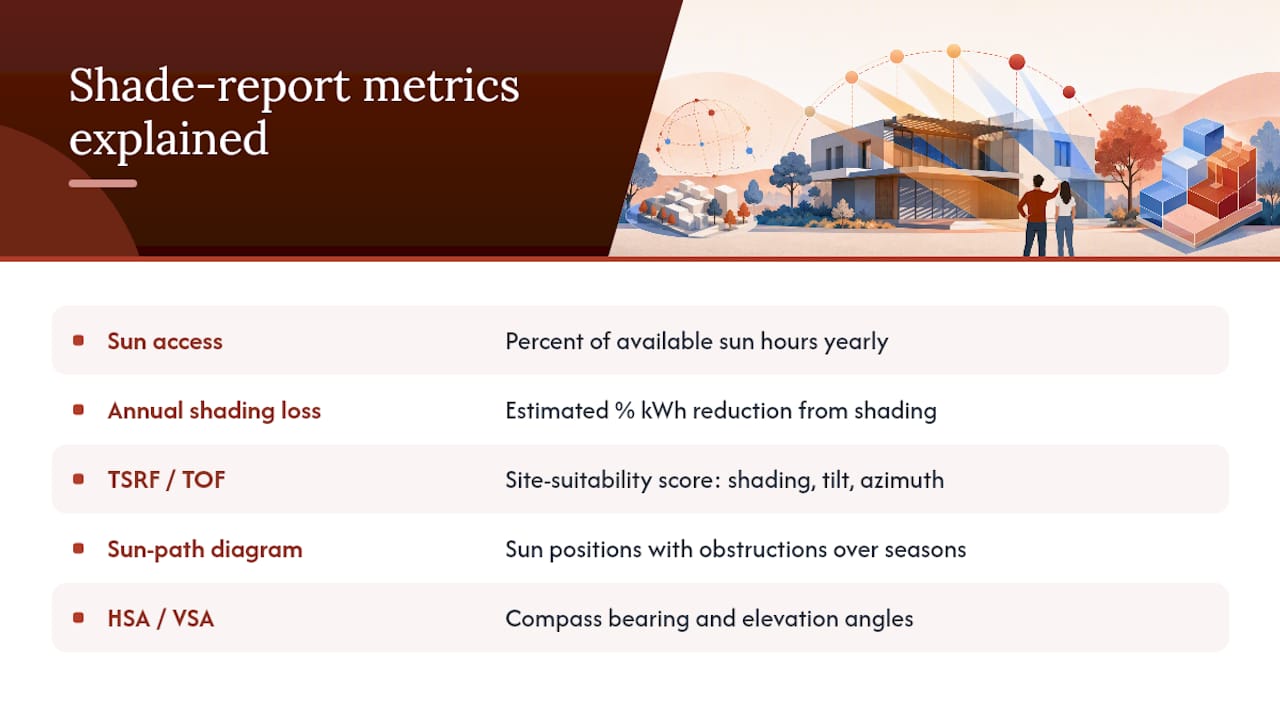
Sun-path diagrams plot the sun’s position across the sky through the seasons, with obstructions overlaid, so you can see exactly when and why a shadow falls.
Horizontal Shadow Angle (HSA) and Vertical Shadow Angle (VSA) come from solar shading design methodology originally developed for sizing overhangs and fins. HSA measures the sun’s compass bearing relative to a wall or window; VSA measures its angle above the horizon. A report using these might state “VSA at 3pm in December: 14 degrees”, telling a designer exactly how far a shading device needs to project.
Statistic Callout: Standards-based calculation methods under EN 410 and EN 13363-1/2 can deviate from simplified methods by up to ±0.10 in gtot values, which matters when a shading result feeds a regulated energy calculation.
How do installers actually collect shading data?
Accuracy depends entirely on the input data, and this is the part most homeowners never ask about. A quick site survey using a fisheye lens or a handheld app gives a rough horizon profile in minutes but misses fine detail like individual tree branches. Drone photogrammetry builds a genuine 3D model of the roof and surrounding obstructions, capturing tree canopy shape that a flat survey can’t. LIDAR scanning goes further, using laser pulses to map terrain and vegetation with real depth, which is why it’s favoured for tree-heavy or complex sites. Satellite-derived horizon data works well for clear urban roofs with no significant vegetation, but struggles where deciduous trees change the picture seasonally.
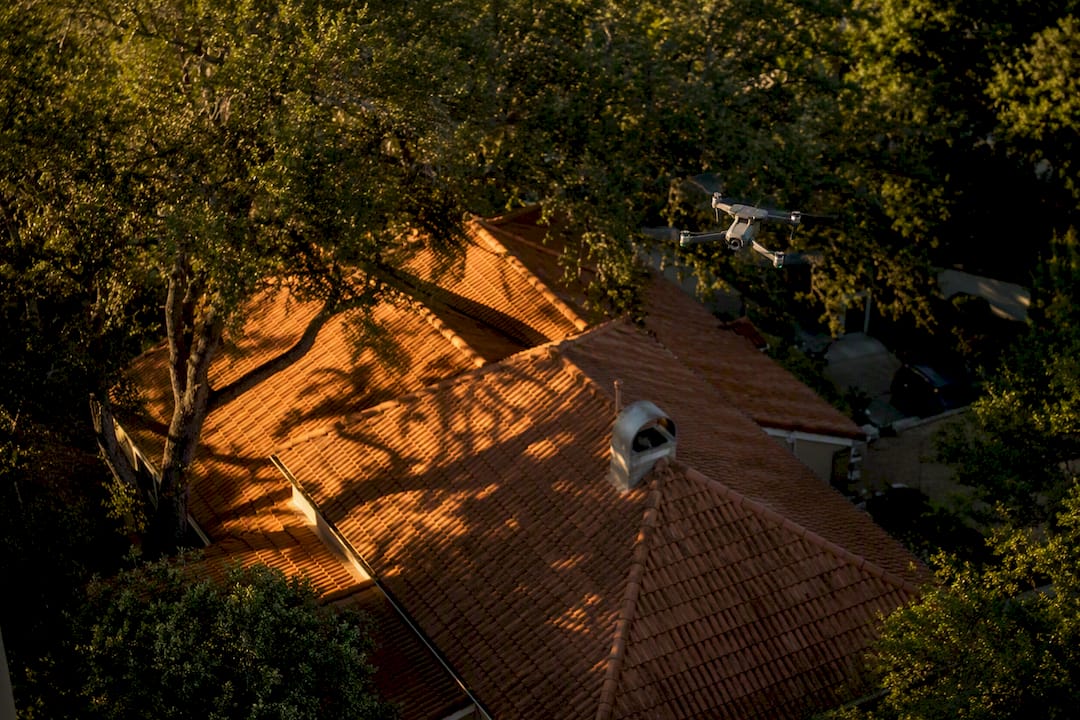
Pro Tip: For a roof surrounded by mature trees or set across multiple levels, insist on drone or LIDAR data rather than a satellite-only estimate. The role shading plays in output is too significant to leave to a rough model on a complicated site.
Which software tools produce these shade reports?
Homeowners rarely interact with the software directly, but knowing what’s behind your report helps you judge its credibility. Shadowmap offers an interactive 3D sunlight and shadow simulation, useful for quickly visualising how shadows move across a roof through the day and year, and it’s the kind of tool an installer might show you on a tablet during a site visit. OpenSolar and HelioScope are cloud-based design platforms popular with installers for quick proposal generation, combining satellite imagery with shading overlays. PVsyst is a desktop application widely regarded as the engineering-grade standard for detailed yield and shading simulation, the kind of tool used when a project needs a bankable financial model. PVGIS, a free European Commission tool, provides solar resource and horizon data useful for quick feasibility checks. SAM (System Advisor Model), from the US National Renewable Energy Laboratory, is another detailed modelling platform used mainly for larger or commercial-scale analysis.
| Comparison dimension | Quick-check tools | Cloud design platforms | Engineering-grade desktop tools |
|---|---|---|---|
| Input data | Satellite, basic horizon | Satellite plus survey data | Detailed 3D, LIDAR, drone |
| Accuracy | Moderate | Moderate to good | High |
| Typical outputs | Sun access, basic heatmap | Heatmap, monthly loss | Full heatmap, TSRF, financial modelling |
| Ease of use | Very easy, browser-based | Easy, workflow-driven | Steeper learning curve |
| Cost/licensing | Free or low cost | Freemium/subscription | Paid, often licensed per user |
How do you read a shade report without missing the important bit?
Start with the headline annual loss percentage, then immediately check the monthly breakdown against it.
Next, look at the panel heatmap. If the same three or four panels show heavy shading month after month, that’s your signal for module-level power electronics rather than a full redesign.
Red flags worth stopping on:
- A single shaded panel reported to cause string-wide losses far beyond its own area, without explanation of the inverter topology involved
- No horizon profile included at all, meaning terrain shading was never modelled
- No monthly breakdown, just a single annual figure with nothing to interrogate
- No stated source for the 3D geometry, so you can’t judge whether it came from a satellite guess or a proper survey
Statistic Callout: Visual heatmaps are, according to shading analysis guidance, the most actionable element of a report because they show designers precisely which modules need separating onto different MPPTs, rather than leaving that as a guess.
What design changes come out of a shade analysis?
The results should drive real decisions, not just sit in a PDF. Common responses include repositioning modules away from the worst-affected roof area, adjusting tilt to reduce winter-sun conflicts, splitting one long string into two shorter ones, and fitting module-level power electronics, either optimisers or microinverters, so one shaded panel stops dragging down its neighbours.
Vegetation management is often the cheapest fix. Removing or crown-lifting a single problem tree can outperform hundreds of pounds spent on optimisers, though it isn’t always within a homeowner’s control if the tree belongs to next door. Passive shading design principles from building physics work the same way in reverse here: get the geometry right early, and you need less hardware to compensate later.
Pro Tip: If your shading analysis shows losses concentrated on a handful of panels rather than spread across the array, optimisers or microinverters usually deliver better value than a full layout redesign.
What should you demand from your installer’s shade report?
Before signing anything, ask for these specific items:
- An annotated panel layout showing exactly which modules are predicted to lose output, and by how much
- Annual loss percentage alongside a full monthly breakdown, not just the yearly total
- A horizon profile showing terrain and distant obstructions were actually modelled
- A stated source for the 3D geometry used, whether that’s a survey, drone capture, or satellite data
- Costed mitigation options if MLPE is recommended, so you can weigh the cost against the predicted energy gain
- A sample heatmap or the raw horizon file itself, if your decision to invest hinges heavily on the shading numbers
A publisher’s note on why this matters on site
Smarthometechnical treats shade analysis as a non-negotiable step before any quote goes out, because guessing at shading on a real roof in Dorset, Hampshire, or Devon leads to disappointed customers and underperforming systems. We’ll happily produce or validate a shade analysis for your property, using proper survey data rather than a satellite guess.
Get a proper shade analysis for your roof
You’ve got options here: a rough satellite estimate from a comparison site, a DIY app on your phone, or a proper site survey from someone who’ll stand behind the numbers. Smarthometechnical runs a full site survey and shade analysis as standard before quoting, using the same monthly-breakdown and heatmap approach this guide has walked through, so you’re never working from a guess.

That means you get an annotated panel layout, a real horizon profile, and a costed view of whether optimisers make sense on your specific roof, before you commit to anything. If your roof has trees, chimneys, or an awkward multi-level layout, this is exactly the situation where a proper survey earns its keep over a satellite estimate. Request a site survey through our solar installations page and we’ll walk you through what the shading numbers mean for your system before you decide on anything.
Where to read more on solar shading standards
The ES‑SO technical guidebook sets out the European calculation standards behind gtot and shading device performance. UN‑Habitat’s shading design notes explain the HSA/VSA method for sizing shading devices from first principles. Shadowmap offers a free interactive 3D shadow simulation worth trying on your own address. PVResources’ shading analysis page gives a concise practitioner summary of what a shading study should cover. For a site visit and full shade analysis on your own roof, visit our solar installations page.
Frequently asked questions
What is a solar shade analysis, in one sentence?
It’s a technical assessment that predicts how much energy your solar panels will lose to shading from trees, buildings, or terrain, expressed as an annual percentage alongside a monthly breakdown and panel-level heatmap.
How accurate is a typical shade analysis?
Methods using drone photogrammetry or full 3D modelling typically achieve around ±2 to 3% annual error under good conditions, while basic satellite-only estimates carry a wider margin, especially on tree-heavy sites.
Does a small amount of shade really matter that much?
Yes, because of how string inverters work. A shadow covering a fraction of one panel can drag down output across the entire string it’s wired into, which is why installers often recommend splitting strings or fitting optimisers on partially shaded roofs.
What tools might my installer use for the shade analysis?
You’re likely to see results from tools like Shadowmap, PVsyst, HelioScope, OpenSolar, PVGIS, or SAM, depending on whether the installer needs a quick visual check or a detailed, finance-grade model.
What’s the one thing I should always ask for?
The monthly breakdown, not just the annual loss figure. A modest annual number can hide a severe winter shading problem that changes whether you need module-level power electronics.
Sources
- Solar shading design notes (UN‑Habitat)
- Solar Shade Analysis 2026: Tools, Methods and Accuracy | SurgePV
- Shading analysis guide + tools – Enervio
- Shadowmap | The Sun for Everyone – Sunlight & Shadow
