
A solar power predictor tool estimates how much electricity a photovoltaic (PV) system will generate at a specific location, using your roof’s orientation, tilt, and local weather data. For a UK homeowner, that means you can get a credible kWh figure before spending a penny on panels, or use live forecasts to decide when to charge a battery or plug in an EV.
Most tools return one or more of the following:
- Hourly or daily kWh output across a typical year
- A clear-sky baseline showing maximum possible generation on a cloudless day
- Probabilistic confidence bands so you can see the realistic range, not just a single optimistic number
The industry term you will encounter most often is solar energy forecasting, which covers everything from a simple postcode estimator to a professional-grade simulation. Predictor tool is the informal shorthand; both refer to the same family of software.
Key takeaways
A solar power predictor tool gives you a probability range for your system’s output, not a guarantee; accurate inputs and professional verification are what turn that range into a reliable plan.
| Point | Details |
|---|---|
| Use GPS, not just postcode | GPS coordinates capture local shading and topography that a postcode centroid misses entirely. |
| Supply your kWp | Every output the tool produces scales from this single figure; find it on your inverter or MCS certificate. |
| Treat outputs as ranges | Plan conservatively around the lower end of the tool’s estimate to avoid over-sizing or budget shortfalls. |
| Verify with a second tool | Running both PVGIS and PVWatts and comparing results within 5–10% gives you a credible baseline. |
| Smarthometechnical validates on site | An on-site survey in Dorset, Hampshire, or Devon replaces postcode defaults with measured data and a firm yield estimate. |
Table of Contents
- What types of solar predictor tools are there?
- How do these tools actually generate a forecast?
- Which inputs most improve your results?
- What accuracy should you realistically expect?
- UK tools you can try right now
- What to do with a prediction once you have one
- What an installer actually looks for in your tool outputs
- From prediction to installation with Smarthometechnical
- Sources
What types of solar predictor tools are there?
Three distinct categories exist, and picking the wrong one for your purpose is the most common mistake homeowners make.
Simple calculators and estimators take a postcode (and sometimes a few extra defaults) and return a ballpark annual yield and rough savings figure. The Energy Saving Trust’s solar panel calculator and Solar Wizard both work this way. They are ideal for a first feasibility check before you have any system details to hand.
Weather-driven forecasts and nowcasts pull live or near-real-time meteorological data to predict output over the next few minutes to several days. Solcast’s rooftop solar forecasts update every 5–15 minutes using satellite cloud motion and numerical weather prediction (NWP), making them genuinely useful for deciding when to run the dishwasher or schedule an EV charge.
Simulation and siting tools use decades of historical irradiance data combined with a full PV model to produce detailed annual yield estimates. PVGIS from the JRC and PVWatts sit in this category. These are the outputs installers actually use when sizing a system.
| Tool type | Primary purpose | Best homeowner use |
|---|---|---|
| Simple calculator / estimator | Quick feasibility and ballpark sizing | First check before contacting an installer |
| Weather-driven forecast / nowcast | Short-term operational decisions | Battery scheduling, EV charging windows |
| Simulation / historical yield tool | Detailed annual kWh and planning | Installer conversations, comparing quotes |
How do these tools actually generate a forecast?
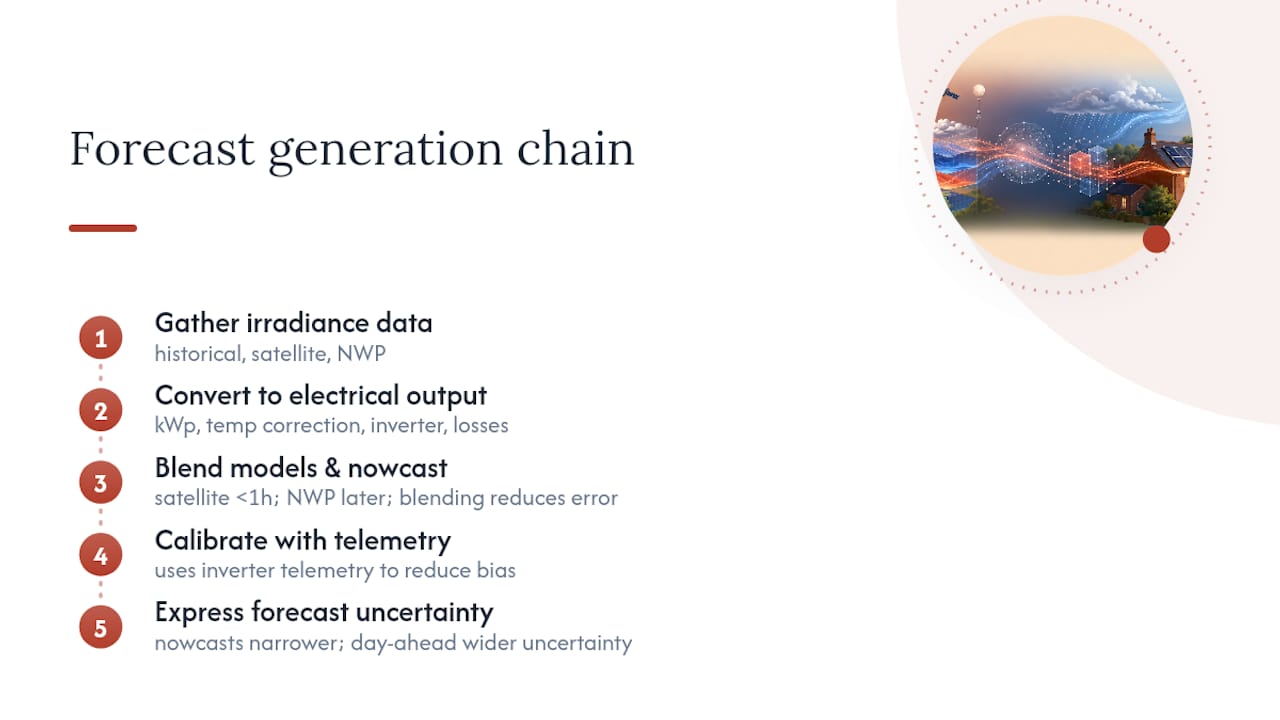
Every solar energy prediction tool, regardless of complexity, works through the same basic chain: gather irradiance data, convert it to electrical output, then express the result with some measure of uncertainty.
Primary data sources are historical irradiance databases (PVGIS holds decades of satellite-derived records for Europe), live satellite imagery, and NWP models such as those run by the Met Office or ECMWF. The better tools blend all three.
Basic PV modelling converts plane-of-array irradiance (the sunlight actually hitting your tilted panels) into watts using your system’s rated peak power (kWp), a temperature correction factor, inverter efficiency, and a losses allowance for soiling and wiring. Change any one of those inputs and the output shifts noticeably.
Model blending and nowcasting is where the more sophisticated platforms earn their keep. Satellite cloud motion vectors show where cloud cover is heading in the next hour or two; NWP takes over beyond that horizon. Research published in MDPI confirms that blending these two sources reduces forecast error compared with either model used alone, and that outputs should always be treated as probability ranges rather than fixed guarantees. Some services, such as those that ingest live telemetry from your own inverter, can further calibrate the model against your actual production history.
Pro Tip: If a tool offers a free API or dashboard, connect it to your inverter’s data feed. Tools that learn from your real production figures reduce persistent bias between predicted and actual output over time.
Short-term nowcasts (under an hour) tend to be most accurate; Solar-forecast refreshes every 15 minutes and supports operational decisions precisely because that horizon is where satellite data is most reliable. Accuracy degrades as the forecast horizon extends, which is why day-ahead figures carry wider uncertainty bands than a 30-minute nowcast.
Which inputs most improve your results?
Accuracy lives or dies on what you put in. A postcode alone gives a rough regional irradiance figure, but it tells the tool nothing about your specific roof.
The four inputs that matter most are:
- Rated peak power (kWp): found on your inverter label or installation certificate. This single figure scales every output the tool produces.
- Panel tilt: your roof pitch in degrees. A 30° pitch is typical for UK homes; flat roofs need a separate entry.
- Azimuth (orientation): the compass direction your panels face. Due south is 180°; southeast is roughly 135°. A 45° error here can shift annual yield by 10–15%.
- GPS coordinates: more precise than a postcode, capturing local topography and shading that a broad postcode centroid misses entirely.
Beyond those four, accurate system inputs including shading data make a measurable difference. Nearby trees, a chimney stack, or a dormer window can cut morning or afternoon output far more than most homeowners expect. Use the tool’s 3D map view or satellite overlay if it offers one; clicking your actual roof outline beats typing a postcode every time.
System losses — soiling on the glass, inverter clipping, cable resistance — typically reduce real-world output compared with the raw irradiance calculation. Most simulation tools apply a default losses figure, but you can tighten it if you know your inverter’s efficiency rating. A solar panel output factors checklist can help you gather these details before you open any tool.
Pro Tip: Your kWp figure is on the MCS certificate if panels are already installed, or on the inverter’s data plate. If you are pre-purchase, use the total panel count multiplied by the individual panel wattage (e.g. 12 × 400 W = 4.8 kWp).
What accuracy should you realistically expect?
No tool gives you a guaranteed number. Solar forecasting is inherently probabilistic because the atmosphere is chaotic, and UK weather is more variable than most of Europe.
Short-term nowcasts (under one hour) are the most reliable, though errors increase with longer forecast horizons. Day-ahead forecasts carry wider uncertainty bands, and annual yield estimates from simulation tools vary due to year-to-year weather differences. Blended NWP and satellite models reduce but do not eliminate that uncertainty.
The main sources of error for a UK home are:
- Imprecise inputs: using postcode defaults instead of measured tilt and azimuth
- Unmodelled shading: a neighbour’s extension built after the satellite image was captured, or seasonal tree growth
- Local microclimate: coastal fog, valley mist, or urban heat island effects that differ from the regional NWP grid cell
- Model assumptions: default losses figures that do not match your actual inverter or panel degradation
Treat any single output figure as the midpoint of a range. Plan conservatively around the lower end of the tool’s estimate and consider the upper end a good year.
UK tools you can try right now
Each of the following is accessible to UK homeowners without specialist software.
- Energy Saving Trust solar panel calculator: a postcode-based estimator that returns annual generation and indicative savings. Good for a two-minute feasibility check with no system details required.
- Solar Wizard (UK): a UK-focused rooftop potential tool that uses your address to assess roof suitability and estimate generation. Useful early in the planning process.
- Forecast: produces hourly rooftop forecasts by combining PVGIS historical irradiance with live weather data. Free tier available; JSON/CSV output makes it easy to feed into home automation or a battery management system.
- PVGIS (JRC): the European Commission’s simulation tool, free, no registration, and widely trusted by installers. Enter GPS coordinates, kWp, tilt, and azimuth for a detailed monthly and hourly yield profile.
- PVWatts: NREL’s accessible calculator, designed for homeowners and small projects worldwide. Straightforward interface, global coverage, and a clear losses breakdown.
- Solcast / Solargis Forecast: professional-grade nowcasting and forecasts up to 14 days, refreshing every 5–15 minutes. Free hobbyist API tier available; best suited to homeowners who want to automate battery or EV charging decisions.
When you take results to an installer, the most useful outputs are your annual kWh estimate, the monthly generation profile, and any shading map the tool produces. Hourly profiles are particularly valuable for sizing a battery correctly. Installers using professional workflows, including those using solar installer planning software, will often run their own simulation, but arriving with PVGIS or PVWatts outputs already in hand speeds the conversation considerably.
What to do with a prediction once you have one
A number on a screen only becomes useful when you act on it.
For planning and sizing: compare the annual kWh figure against your household’s annual consumption (on your electricity bill).
For verifying quotes: ask any installer for their simulation outputs, not just a headline savings figure. Discrepancies usually trace back to a different shading assumption or a different losses figure.
For operational scheduling: solar forecasts integrated with time-of-use tariffs let you shift EV charging or battery top-ups to windows when your panels will be producing most. Build in the forecast’s error margin when setting charge rules; on an unexpectedly cloudy day, a battery that discharged overnight based on an over-optimistic forecast leaves you buying expensive peak-rate power. Read the solar planning guide for a fuller picture of how predictions feed into system design decisions.
For cross-checking: if panels are already installed, log a week of actual production and compare it to what the tool predicted for the same period.
What an installer actually looks for in your tool outputs
Most homeowners arrive with a savings figure from a postcode estimator and not much else. That is a starting point, not a specification.
What genuinely speeds up a survey is a PVGIS or PVWatts run with your measured tilt and azimuth already entered, a note of your kWp assumption, and a photograph of the roof showing any obstructions. The annual kWh figure matters less than the monthly profile, because that is what determines whether a battery will cycle usefully in winter or sit idle.
The most common mistakes I see are trusting the default south-facing orientation when the roof faces southeast, ignoring a chimney that shades the array for two hours every morning, and treating the tool’s midpoint estimate as a guaranteed minimum. A postcode estimator cannot see your chimney. A satellite image from three years ago cannot see the extension your neighbour built last summer.
Pro Tip: Before a survey, take photos of your roof from the garden at 9 AM and 3 PM on a clear day. Those two images show an installer exactly which obstructions cast shadows and when, saving significant time on the shading analysis.

The role of shading on energy output is consistently underestimated at the planning stage, and it is the single input most likely to make a real-world system underperform its predicted figure.
From prediction to installation with Smarthometechnical
Running a PVGIS estimate is a solid first step. Getting it validated against your actual roof is where the numbers become reliable enough to commit to.

Smarthometechnical carries out on-site surveys across Dorset, Hampshire, and Devon, measuring tilt and azimuth directly, assessing shading from every angle, and producing a bespoke kWh/year estimate tied to your specific property rather than a regional average. That survey output covers system sizing, battery pairing options, and EV charger integration so you can see the full picture before signing anything. If the numbers from your predictor tool look promising, the logical next step is a professional survey to confirm them. Book a solar installation survey with Smarthometechnical and get a firm, site-specific production estimate.
Sources
- Solar Power Forecasting – Free PV Forecast for 3 days | API | Dashboard
- MDPI article on solar forecasting (model blending and probabilistic forecasts)
- PVGIS Solar Simulation Tool – JRC – European Union
- PVWatts Calculator
- Solargis Forecast – Solar power forecasting for PV plants
Recommended
- How solar reduces your household bills: a homeowner’s guide – Smart Home Technical Ltd
- Why solar panels lose efficiency: a UK homeowner’s guide – Smart Home Technical Ltd
- The role of solar optimisers: a homeowner’s guide – Smart Home Technical Ltd
- How solar planning works: a homeowner’s guide 2026 – Smart Home Technical Ltd
