
A solar energy cashflow model is a homeowner-scale spreadsheet that turns your installation cost, expected generation, self-consumption rate and export income into a year-by-year picture of savings, so you can see when the system pays for itself and what it earns after that. The core formula is blunt: simple payback = system cost ÷ annual total value, where annual total value is what you save on imported electricity plus what you earn from exporting the rest.
For a typical rooftop domestic system, realistic payback sits somewhere between 6 and 12 years once you use conservative generation figures rather than an installer’s best-case sales number. Two things move that figure more than anything else: how much of the power you actually use yourself, and how much you paid for the kit in the first place. Get either wrong and your payback estimate can drift by years, not months.
Key Takeaways
A solar energy cashflow model works because it replaces a single optimistic payback number with a realistic band driven by self-consumption and installation price.
| Point | Details |
|---|---|
| Core formula | Simple payback = system cost ÷ (import savings + export income); build this before comparing any quote. |
| Self-consumption drives payback | Shifting self-use from around 30 to 50% to 60% cut simple payback by roughly 2.5 years in the worked example. |
| Model in bands, not averages | Run conservative, central and optimistic scenarios rather than trusting one headline figure. |
| Batteries need their own line | Treat battery cost and savings separately so you can judge its standalone payback. |
| Get a survey to confirm the model | Smart Home Technical can review your spreadsheet inputs or run a full site survey to replace estimates with measured data. |
Table of Contents
- What goes into a solar cashflow model
- How to build a solar cashflow model step by step
- A worked example: 3.8 kW system with three self-consumption bands
- Batteries, inverters and other lifecycle costs
- Which assumptions actually move the numbers
- How to sanity-check an installer’s payback figure
- A ready-to-use spreadsheet template
- When the numbers say go, and when to get help
- What I’ve learned from years of solar quotes and installs
- How Smart Home Technical can help you get the numbers right
- Sources
What goes into a solar cashflow model
Before you can build anything useful, you need to collect the right inputs. Most quotes and bills already contain everything you need. You’re just extracting it and putting it into a form that lets you do arithmetic on it.
- Installation cost including VAT, scaffolding, and any civils or roof work. UK domestic solar and battery installations currently benefit from 0% VAT, so check whether your quote already reflects that.
- Expected annual generation in kWh, ideally a conservative figure rather than the installer’s headline number.
- Self-consumption percentage, the share of generated power you use directly rather than export.
- Import unit rate in pence per kWh, taken straight from your current tariff.
- Export tariff rate, whatever your Smart Export Guarantee or smart tariff pays per exported kWh.
- Battery cost and expected behaviour, if you’re adding storage.
- Inverter replacement allowance, because inverters don’t last the lifetime of the panels.
- Any finance costs, if you’re borrowing rather than paying cash.
A few optional inputs add realism without much extra work: an assumed rate of electricity price inflation, a panel degradation rate, a maintenance reserve, and any grant or incentive that reduces the upfront cost. None of these are essential for a first-pass model, but they matter once you’re projecting ten or fifteen years out.
One line item people consistently forget is the inverter. Most inverters last 10 to 15 years, which means a system installed today will likely need a mid-life inverter swap before the panels themselves are anywhere near retirement. Leaving that cost out of your model makes the long-run numbers look better than they’ll actually be.
How to build a solar cashflow model step by step
You don’t need financial modelling software for this. A calculator and a notebook will do, though a spreadsheet makes it far easier to test different scenarios later.
Step 1: Total installed cost. Add up the full quote, including VAT status, scaffolding, and any roof reinforcement.
Step 2: Estimate annual generation. Use a conservative postcode-based or installer-supplied kWh figure rather than the optimistic end. A 4 kW system typically produces around 3,200 to 4,200 kWh a year, depending on orientation, shading and local weather. A checklist of the output factors that affect generation is worth working through before you settle on a number.
Step 3: Choose a self-consumption band. Without a battery, most households self-consume 30 to 50% of what they generate. Add storage or shift laundry and dishwasher use to daylight hours, and that share climbs sharply, which is the single biggest lever in the whole model.
Step 4: Calculate import savings. Multiply self-used kWh by your import rate. This is usually the largest value in the whole calculation, because avoided import at 24 to 28p per kWh generally beats what export tariffs pay for the same unit.
Step 5: Calculate export income. Multiply exported kWh by your Smart Export Guarantee or smart tariff rate. SEG rates vary widely, commonly 5p to 15p per kWh.
Step 6: Add the two together and divide. Annual total value = import savings + export income. Simple payback = system cost ÷ annual total value. If you want a longer-term view, knock roughly 0.5% a year off generation for panel degradation, and factor in electricity price inflation if you’re projecting past year five or six.
A worked example: 3.8 kW system with three self-consumption bands
Numbers make this concrete. Take a 3.8 kW system costing £6,800 installed, producing a conservative 3,600 kWh a year, on an import rate of 26p/kWh and an export rate of 10p/kWh.
| Self-consumption band | Self-used kWh | Exported kWh | Annual total value | Simple payback |
|---|---|---|---|---|
| Low | 1,080 | 2,520 | £561 | 12 years |
| Mid | 1,620 | 1,800 | £619 | 11 years |
| High (60%) | 2,160 | 1,440 | £706 | 9.6 years |
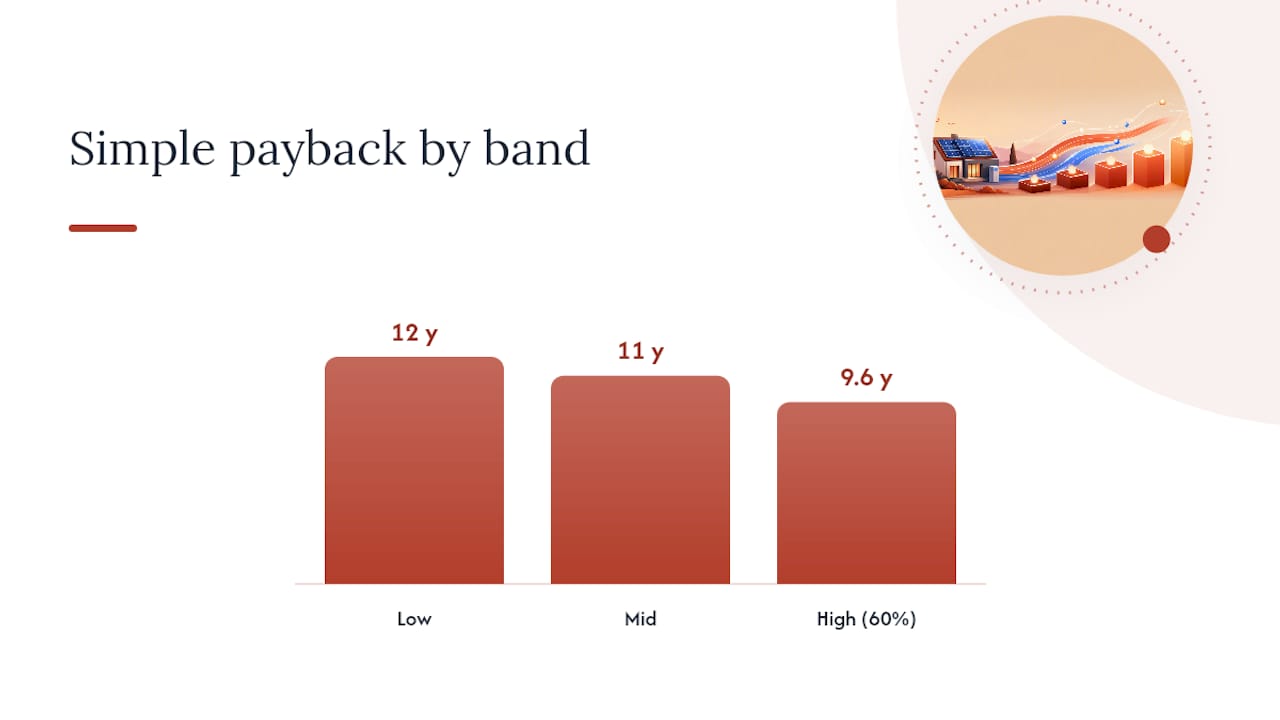
That’s a swing of roughly two and a half years just from shifting self-consumption between bands, with no change to the system cost or the tariffs. It lines up with the pattern seen across UK domestic installs, where 4 kW systems commonly land around 11 to 13 years on conservative blended assumptions.
The lesson isn’t “buy a smaller system” or “always add a battery”. It’s that your own usage pattern, more than the panels themselves, decides which end of that table you land on. If you’re often out during the day, the low band is your honest starting point. If you work from home or run a business from the property, the high band is realistic without any storage at all.
Batteries, inverters and other lifecycle costs
Adding a battery raises self-consumption, sometimes dramatically. A 5 kWh battery can push self-consumption from the 30 to 50% baseline up to roughly 60 to 75%, and a 10 kWh unit can take it further still, into the 70 to 85% range for many households. The catch is upfront cost. A battery often adds one to three years to the simple payback figure even though it increases lifetime savings and cuts your reliance on the grid.

Rather than blending the battery into one combined payback number, model it as its own line. Take the battery’s added cost and divide it by the extra annual value it unlocks compared with panels alone. That gives you a standalone battery payback you can judge on its own merits, separate from the solar array. It also makes it obvious whether the battery pays for itself inside its likely service life, which for most lithium battery systems runs well beyond a decade. Reviewing real battery savings from completed projects is a useful sense check before committing.
Don’t forget the inverter replacement. Budget for a mid-life swap around year 10 to 15, and if you’re running any deep cycle storage alongside the panels, a battery monitor makes it far easier to see whether the storage is actually delivering the self-consumption uplift your model assumes.
Pro Tip: Build a separate row in your spreadsheet just for the battery: its cost, its incremental annual value, and its own payback line. If the panels pay back in nine years and the battery adds another three on its own, you’ll know exactly what you’re paying for and why, rather than one blurred combined number that hides the trade-off.
Which assumptions actually move the numbers
Not every input matters equally. Focus your effort on the ones with real leverage rather than fiddling with figures that barely shift the outcome.
The highest-impact assumptions are self-consumption share, installation price, import rate, export tariff, panel degradation and shading. Of these, self-consumption and quote price do most of the work; location and sunlight hours matter, but they’re supporting factors rather than the main driver. Even a price difference of £1,000 to £1,500 between two quotes for a similar system can shift payback by a couple of years.
For each assumption, set a conservative, central and optimistic value rather than picking a single number and hoping. Conservative generation uses the low end of your postcode’s range; optimistic uses the installer’s headline figure. Run all three combinations and you’ll get a payback band, not a false single point. Averages routinely mislead here, because a single “average” number hides how sensitive the answer is to your actual habits.
How to sanity-check an installer’s payback figure
Installers sometimes quote an optimistic single-number payback that doesn’t survive contact with real usage patterns. Before you sign anything, ask these questions and insist on the raw numbers behind the headline figure.
- What self-consumption percentage have you assumed? If they can’t give you a number, the payback figure is guesswork.
- What import and export rates are you using? Rates baked into a quote from months ago may no longer match your actual tariff.
- Have you confirmed the export MPAN and metering setup? Without proper export metering, you can’t actually claim Smart Export Guarantee payments.
- What degradation rate is built into the long-term projection? A model with no degradation assumption is overstating year-ten output.
- Is an inverter replacement allowance included? If the payback period stretches past ten years and there’s no replacement line, the model is incomplete.
- Is the battery payback modelled separately from the panels? A blended number can mask a battery that barely pays for itself.
- What generation figure and shading assumption underpins the quote? Ask to see the site-specific yield estimate, not a generic regional average.
If any answer is vague, check assumed self-use, rates, metering and shading yourself before trusting the headline number.
A ready-to-use spreadsheet template
You can build this in Excel or Google Sheets in under ten minutes. Set up these columns: system cost, annual generation (kWh), self-use %, import rate (p/kWh), export rate (p/kWh), battery cost, inverter replacement allowance, annual degradation %, and electricity inflation %.
The formulas are straightforward:
- Self-used kWh = generation × self-use %
- Exported kWh = generation × (1 − self-use %)
- Import savings = self-used kWh × import rate
- Export income = exported kWh × export rate
- Annual total value = import savings + export income
- Simple payback = system cost ÷ annual total value
- Cumulative cashflow (year n) = cumulative cashflow (year n−1) + annual total value, adjusted each year by (1 − degradation %) on generation and (1 + inflation %) on rates
Here’s a starter example you can copy directly:
| Input | Low | Mid | High |
|---|---|---|---|
| Self-use % | around 30 to 50% | around 30 to 50% | 60% |
| Annual generation (kWh) | 3,600 | 3,600 | 3,600 |
| Import rate (p/kWh) | 26 | 26 | 26 |
| Export rate (p/kWh) | 10 | 10 | 10 |
| Annual total value | £561 | £619 | £706 |
Duplicate the mid column, apply your own system cost and rates, then drag the degradation and inflation adjustments down twenty rows to see the full cumulative picture. If you’d rather refine the generation figure with proper postcode data before committing to numbers, a solar power predictor tool will get you closer than a rough estimate.
When the numbers say go, and when to get help
A simple rule of thumb: if your low-band payback comes in under seven years, the project is robust and worth proceeding with. If acceptable payback only appears in your high band, either get more quotes, reconsider the system size, or push harder on the assumptions before committing money.
From there, the next steps are practical rather than financial. Request a site survey so the generation estimate reflects your actual roof, not a generic figure. Ask installers for their model inputs in writing, not just a headline payback number, so you can compare quotes on a like-for-like basis. And if you’re weighing a battery, multiple roof orientations, or a business premises with a more complex usage pattern, that’s the point at which a professional cashflow model, including maintenance schedules and replacement phasing, earns its keep over a homeowner spreadsheet.
What I’ve learned from years of solar quotes and installs
The recurring pattern on real jobs isn’t dishonest quoting, it’s optimistic defaults baked into standard software that nobody adjusts for the actual household. A retired couple at home all day and a family who leave the house empty from 8am to 6pm will get wildly different self-consumption from the identical system, yet plenty of quotes use the same blanket assumption for both.
A few things worth passing on. Size the system for your actual usage pattern, not the size of your roof, because an oversized array just exports more of its output at a lower rate than it would save you on import. Check shading properly, including winter sun angles, not just a summer site visit, since a chimney or neighbouring tree that’s harmless in June can knock out an hour of generation in December. And always keep the battery as a separate financial decision from the panels, because bundling them into one number hides which part of the investment is actually doing the work.
Where the numbers get genuinely complicated, particularly for a business premises with variable daytime usage, running a proper bespoke model or a full site survey beats guesswork every time.
How Smart Home Technical can help you get the numbers right
Building your own spreadsheet is a good first pass, but nothing beats a model built from an actual site survey, real roof measurements, and shading data specific to your property. Smart Home Technical runs MCS-standard installations across Dorset, Hampshire and Devon, and that means every quote we give comes with the generation, self-consumption and payback assumptions shown clearly, not buried in a single headline number.

If you want a second opinion on an installer’s payback figure, or you’re ready to move from spreadsheet to survey, our solar installations team can review your model inputs, size a battery correctly against your usage, and talk you through warranty and workmanship cover before you commit. Every installation comes with post-installation support, so the payback figure you’re shown at the start is one we stand behind afterwards. Get in touch to book a site survey and turn your spreadsheet estimate into a properly surveyed quote.
Sources
- Solar Payback Calculator Guide – How to Calculate Solar ROI in the UK – Modern Home Blueprint
- Solar payback periods in the UK: why averages mislead homeowners
- Solar Panel Payback UK (2026): Average Electric Bill Savings & ROI
- Solar payback calculations | Switch to Octopus
This article is general information, not a substitute for advice from a qualified financial advisor. Consult a qualified financial professional about your own circumstances before acting on anything here.
